
Knowledge Graphs and Ontologies
Published:
This article introduces knowledge graphs – a technology that is significantly underrepresented in the media and is particularly known for its precision and explainability. The article remains at a user level throughout, offering the most accessible introduction to the topic possible.
This article is part of a larger series of introductory AI tutorials I wrote in german and is auto-translated.
1. Introduction and Motivation
While deep learning continues to gain prominence through hobbyhorses such as GenAI and reinforcement learning through robotics, a technology is developing in the background into a powerful tool for large companies and specialised domains: knowledge graphs. These structures are special because they are not explicitly based on machine learning, but can still be confidently classified as belonging to the field of artificial intelligence. As a result, knowledge graphs already form their own field in theory and research, one that even some AI scientists have never heard of. At the same time, they are used in many key domains as the backbone of knowledge management – whether in biology, medicine, aircraft construction, the military, the police or social media. This article attempts to close precisely this gap in representation. At the same time, it aims to serve as an outlook beyond the horizon and show that AI is not always just what the consumer sees. In contrast, many advances towards truly usable and rapidly accelerating AI algorithms are only mentioned as a side note or not at all in the media.
What is an ontology?
In a 2005 article, the German Informatics Society describes an ontology as ‘a term borrowed from philosophy, where it refers to the doctrine of being’. Computer science has adopted this term and redefined it as a formal, explicit and interchangeable specification, usually limited to a specific domain. In practical terms, an ontology organises things and their relationships in a self-contained universe. → An ontology is therefore the class definition for everything in the real or virtual world that we want to represent!
What is a knowledge graph?
A knowledge graph is an instance of an ontology, i.e. a knowledge graph that represents individual instances and their relationships. Unlike ontologies, knowledge graphs are significantly larger and contain many different instances of objects. Knowledge graphs store data purely as subject-predicate-object, whereby the subject and object are typed based on the specified ontology. This simple storage method allows indexing based on subject and object in a triple store or graph database.
The strength of this approach lies in the flexibility with which knowledge is represented. While relational databases have a very strict schema and column tables, key-value stores or object storages are completely open, ontologies enable the storage of information and facts with a domain-specific structure. Each piece of information is reduced to its semantic minimum, a type, while everything else is stored via a connection – a relation between two objects. This allows information to be stored in a structured manner and exchanged in a targeted manner at the same time. In addition, data integration is very easy, as we can enter almost atomic information as the smallest unit. This makes the hurdle significantly lower than with entire database entries. A single entry can be interpreted semantically very easily through the aggregated connections of the instances, allowing information to be obtained from the environment – in this case, understood as context.
Today, the topic is particularly relevant due to simple data integration and explainability. Information can be parsed using natural language processing, derived from semi-structured contexts or defined via structured transfer points. This integration method offers enormous advantages, particularly in heterogeneous environments: content depth is rarely lost, information from different sources is linked much more effectively than in comparable methods, and highly efficient queries with a dense flow of information are possible.
The topic is becoming increasingly important because fast and comprehensive representations of data are becoming more and more crucial. In addition, knowledge graphs form a fundamental basis for important artificial intelligence algorithms. For example, Bayesian networks, recommender systems, graph-based retrieval-augmented generation, and graph neural networks are only possible thanks to knowledge graphs.
2. Technology, interoperability and queries
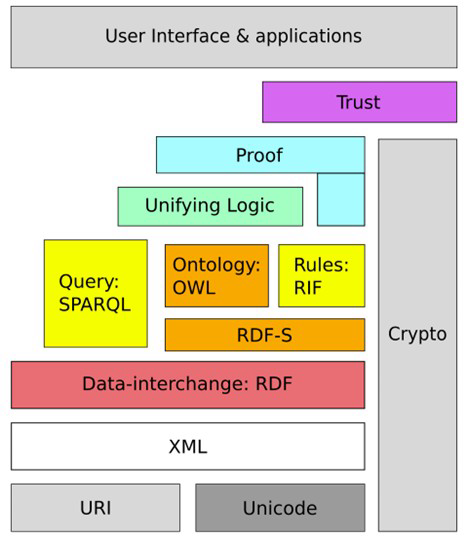
The idea of knowledge graphs was made famous by Tim Berners-Lee, the inventor of the internet. He proposed representing all information on the internet in the form of RDF – a definition language for knowledge graphs – and capturing everything as a formal model. Although this idea did not completely catch on, it gave rise to many concepts that are still useful today. This idea was called Semantic Web and is still a very influential concept today. It has been taken up by Wikidata, Google and DBpedia.What makes it special: Even though the Semantic Web has not yet become fully established, standards have been developed from it that are now used worldwide:
- RDF (Resource Description Framework) – for describing resources and their relationships
- RDFS (RDF Schema) – for taxonomies and type definitions
- OWL (Web Ontology Language) – for more complex ontological models
These standards are based on XML and define meta-models and models. They are considered one of the greatest achievements of the Semantic Web. Why?
Individual huge open graphs describe the world in very concrete terms. However, the practical thing about knowledge graphs is not only that they contain a lot of knowledge, but also that ontologies can be linked together. This allows information to be summarised and expanded in the nodes of the knowledge graphs. Here, it is important to ensure a consistent graph. There are domain-specific graphs for different areas: in medicine, diseases, symptoms and medications are recorded; in biology, genomes, effects and correlations are documented; and financial institutions can also store data on companies or loans in such graphs.
Application example
Our goal here is to create a small query to the WikiData query site about the novel ‘Around the World in 80 Days’:
Dazu soll zunächst die Seite http://query.wikidata.org and the query below can be executed. Although no specific query language has been defined that complies with RDF or OWL standardisation, SPARQL – an SQL-like language – has become established.
Our example looks like this:
SELECT DISTINCT ?s ?sLabel ?p ?pLabel ?o ?oLabel WHERE {
  VALUES ?start { wd:Q1219561}

  {
    ?start ?p ?o .
    BIND(?start AS ?s)
  }
  UNION
  {
    ?s ?p ?start .
    BIND(?start AS ?o)
  }

  SERVICE wikibase:label {
    bd:serviceParam wikibase:language "[AUTO_LANGUAGE],de,en".
  }
}
This query returns all nodes from the Wikidata knowledge graph with a distance of 1 to node wd:Q1219561. It should be noted that this node describes the novel. This first ‘hop’ query alone – i.e. the query of all elements with a distance of 1 – returns 682 instances.
In the query, we select all entries that interest us in the first line: subject ?s, subject name ?sLabel, predicate ?p, predicate name ?pLabel, object ?o and object name ?oLabel. We select these by allowing all predicates and objects that have either ?s ?p ?start or ?start ?p ?o as a relation to our start node. The last line only includes labels in German and English. Now you can execute the query using the play button on the left-hand side and after a short wait you will receive a table. You can convert this into a graph by selecting it in the drop-down menu. An overview of all objects related to the book should appear as illustrated here:

The increase in predicates or another level has been omitted here, as otherwise a clear presentation would not be possible. However, if you expand exponentially interesting nodes, you can quickly see how many data points are transmitted and how dense the knowledge about the requested object is. The user can expand another node in this overview. wd:Q28840678 can also be replaced by other interesting data points. These can be found in Wikidata using a simple search.
Have fun trying it out for yourself!
Why graphs? - An in-depth theoretical insight
Graphs offer several advantages over lists, databases or documents. We will take a closer look at these and explain them in more detail here.
Path queries
The ability of graphs to generalise and draw complex logical conclusions arises solely from the automatic querying of different paths via the definition of properties that objects should have. Therefore, each relationship is converted into an atomic state in which only the minimum necessary information itself is available. However, these properties make this method less intuitive for developers and researchers. It is inherently difficult to measure this emergence across the entire network – one can only compare ‘architectures’ in this sense. In addition, it is difficult to develop automatic metrics for correct retrieval of facts, to separate the query method and the capability of the network from each other. This raises the central question: What should a good knowledge graph look like?
Data networking, power law and hubs
Graphs have the advantage that ontologies can be used to create good templates that lead to semantic consistency. One task of these ontologies is to standardise the individual atoms – i.e. the connections between nodes – between unique entities. This facilitates the integration of data and enables precise queries, even for properties that would not easily fit together in a highly normalised database.
In addition, completeness within the target domain and up-to-date data are crucial for good results. Similar to standard RAG, information can be changed on the fly. The more complete and up-to-date the data, the more accurate the queries and analyses will be.
The network should have central key nodes, known as hubs. These nodes connect many sub-areas and enable short path length jumps for very complex queries using multi-hop reasoning. Interestingly, common networks rarely feature small-world approaches, i.e. topologies that enable very short hops over long distances. This is remarkable, as the small-world phenomenon occurs frequently in natural networks and this property could be particularly advantageous for multi-hop reasoning. So there is still a lot of untapped potential here in research.
Explicit semantics and explainable queries
While conventional RAG primarily evaluates similarities and does not take content-related connections into account, analysis using knowledge graphs focuses on the explicit relationships between entities. This allows for more precise statements to be made about content, leading to more relevant results and more accurate answers. In addition, a detailed explanation can be provided for each fact in an answer, creating a closed chain of reasoning. This is particularly important in areas with high compliance requirements, where AI may only be used with very precise explainability. Atomic storage also enables an effective top-down approach for complex queries at inference time.
Data integration and transparency
Each data point can be tracked individually and separately. Ontologies provide clear templates, which greatly simplifies the integration of data from tables, forms or raw text. There are a number of solutions available for this purpose, ranging from simple adapters to complex entity parsers.
3. What does Knowledge Graphs actually enable?
This chapter provides an overview of the possibilities offered by Knowledge Graphs, beyond the RAG example used throughout this article. The aim is to highlight the wide range of potential that arises from the creation of Knowledge Graphs. This chapter is largely based on parts of the book Knowledge Graphs.
Deductive methods
In our context, deductive methods are top-down methods in which new insights are gained from explicit knowledge and data by looking at the graph as a whole. The aim is to automatically derive new facts from existing knowledge. These can either be used to expand the graph or actively employed for analysis. Typical features of deductive methods are a reasoner, specific constraints and strict inference rules.
Formal logic through ontologies
Ontologies can be used to define a formal logic that checks semantic implications from various statements. To do this, words are combined into entities with relationships, and statements are checked against a knowledge graph or ontology. Similarly, facts in the graph itself can be checked against other statements to identify inconsistencies and false premises. Well-prepared ontologies that represent relationships between objects are essential.
Jules Verne wrote Around the World in 80 Days + Around the World in 80 Days was written in 1872 → Jules Verne was alive in 1872
Jules Verne wrote Around the World in 80 Days + Around the World in 80 Days is a Book → Jules Verne is an Author
In addition to facts, roles and relations can also be inferred, as in the second example. Well-defined transitive properties also enable entities to be typed based on their context.
Rule-based methods
Rule-based methods examine individual graphs and check the relationships between entities to ensure data quality. SWRL or SHACL rules are used to define the conditions that must apply to certain entities. For example, incorrect value ranges or relationships are quickly detected, and violations of constraints can be easily identified. These methods are particularly interesting for fraud detection and data quality measures. Incorrect information in forms or banking transactions can be easily detected, as inconsistencies are immediately apparent.
Main advantage: Knowledge graphs provide reliable, verifiable results that can be traced directly. At the same time, a complete data model is maintained, even if certain facts are not yet available.
Inductive methods
The second class of methods does not require models like the deductive top-down methods, but is based directly on the data and analyses it to derive patterns. These are data-driven processes that allow us to extract patterns from individual inputs without specifying explicit rules. Here, we are once again very close to the classic field of machine learning.
Graph analytics
Many specialised cases can be mapped by analysing graph structures. This often allows us to identify interesting clusters, determine circular structures or examine cliques. Important nodes can be quickly identified and examined in more detail. Whether it’s fraud detection in the financial industry, genetic relationships between genomes, or social structures in social media – all of this can be mapped in graphs and analysed using graph analytics. Knowledge graphs have the advantage here that the semantics of the individual relationships can also be taken into account.
Graph Embeddings
Individual nodes can be embedded in a direct context via their environment. This enables more advanced tasks such as recommender systems, retrieval systems, query relaxations or fuzzy search. What is special here is that semantics can be taken into account via the neighbourhood of adjacent nodes – in contrast to classic text embeddings. An example of an algorithm that uses continuous embeddings is Node2Vec.
Graph Neural Networks
In contrast to learning with graph embeddings, the architecture of the neural network in GNNs is based on the connections in the graph, enabling classic end-to-end training. GNNs can be used, for example, to analyse and classify transport networks, atomic structures or documents. Graph networks exist in recursive and non-recursive versions; however, a detailed explanation of these differences would be too technical for this context.
Symbolic learning
Symbolic learning is the only non-numerical, rule-based variant. Unlike the technologies presented so far, it is still in an early stage of development and will take time before it can be used productively. Important concepts include rules, axioms and hypothesis mining. The aim is to derive concrete rules, universally valid axioms or interesting hypotheses from semantic data. Symbolic learning is currently of particular interest as a preliminary stage to neurosymbolic learning.
Neuro-symbolic reasoning
Object representations in knowledge graphs can be used for neuro-symbolic reasoning, combining concepts from machine learning and knowledge graphs.
The promise: AI not only learns tasks end-to-end, but also uses logic in the form of reasoning and knowledge in the form of symbols from graphs to learn from a few examples.
AI should therefore not only recognise distributions, but also learn, reason and plan – based on the rules of the world. The world is first broken down into individual parts (e.g. through entity recognition or object detection) and a plan is created from this, which in turn can be divided into smaller subtasks. Similar to the atoms in our ontologies, these small parts can be easily learned and stored because they exhibit little variance. This compositional nature allows tasks to be scaled much better without having to use an exponential amount of training data.
In practice, this approach is particularly interesting for agentic or automated tasks as well as for high-stakes domains such as law, finance or medicine, where robust generalisation and traceable decisions are particularly important.
Advantage:
→ Less can go wrong because tasks are broken down into smaller steps and each intermediate step is documented.
4. Knowledge graphs in practice
This chapter deals with the practical use of knowledge graphs in companies in 2025. One aspect we have deliberately omitted is the creation, maintenance, improvement and productive querying of knowledge graphs. This is due, on the one hand, to the depth of this article and, on the other hand, to the necessary prior knowledge in the field of NLP. Anyone interested in these topics should refer to the book Knowledge Graphs, which covers them in detail. Knowledge graphs and ontologies are generally not widely promoted and are handled with little transparency. This chapter aims to convey one key insight: the most important large companies rely on knowledge graphs. These include tech giants such as Google, Bing, Ebay, Amazon, IBM Meta, LinkedIn but also non-digital natives such as Axel Springer, Swiss RE, Airbus, Thomson Reuters, Elsevier, Roche, Novartis, Siemens, or EnBW.
Knowledge graphs as a product
Some well-known companies offer knowledge graphs as a software product to provide easy access to this technology. It should be noted that this often results in vendor lock-in, particularly due to the initial hurdles involved in creating ontologies, integrating data and setting up pipelines for automatic improvement. It is therefore important to consider early on which technology from which provider to use and to make a well-considered make-or-buy decision. Some particularly prominent products in the field of knowledge graphs are listed below:
Palantir Technologies with Gotham and Foundry
Since the early 2000s, Palantir has specialised in the creation and evaluation of large ontologies and data sets in the form of knowledge graphs. The first successes of this approach have been evident since 2010, particularly in the context of espionage. These products are particularly interesting because they are already being used by German authorities and operators of critical infrastructure.
- Gotham is advertised on the Palantir website with three promises: ‘Powering the Kill Chain’, ‘Task sensors & effectors’ and ‘Ops Centre anywhere’. Its customer base includes not only Ukraine, Israel, many US intelligence agencies, the US military and police units, but also Europol and German authorities such as the Bavarian police, the LKA Hessen (project under the name Hessendata) and the Baden-Württemberg police. It can be assumed that other customers use the system, but they are not publicly named due to confidentiality agreements.
- Foundry is the civilian counterpart to Gotham. It is used less in government agencies, but is widely used in critical infrastructure. Customers of this tool include large companies such as BP, Swiss RE and IBM. In Germany, Airbus, Axel Springer, Telekom and EnBW, among others, use Foundry. Foundry probably played a particularly influential role during the coronavirus pandemic: in the United States, it was used to coordinate vaccine distribution, in collaboration with the NIH and Johns Hopkins University, among others. It is very likely that some of the global coronavirus dashboards were fed via Foundry, even though Palantir and JHU have not released any official information on this.
IBM with Watson Discovery
Together with the Knowledge Graph Framework, Watson Discovery offers a product that can read documents, extract entities and relations, and convert them into knowledge graphs. Ontological templates are also already provided for individual domains.
Enterprise knowledge managed in knowledge graphs
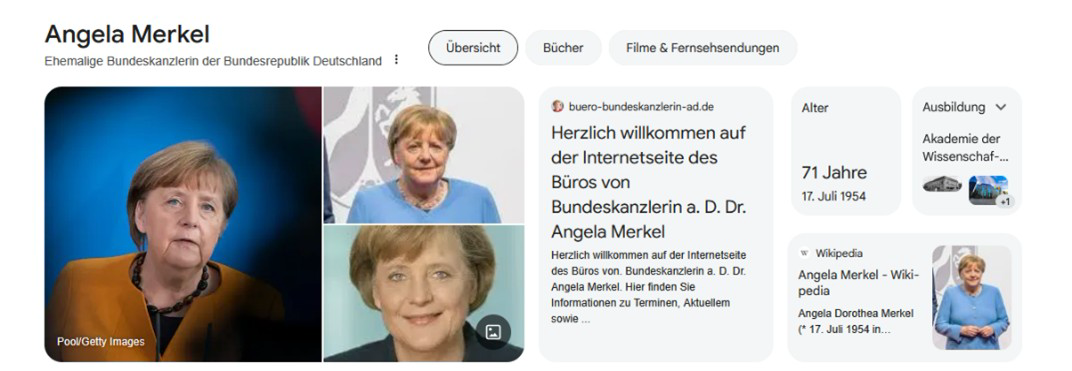
Google’s Knowledge Graph
Google Research operates its own knowledge graph, which complements various services such as AdSense, YouTube, Maps and Search. A well-known example are the info cards that appear when searching for entities that already exist in the knowledge graph.
Meta’s TAO Graph Store Meta’s data infrastructure uses an in-house knowledge graph to generate suggestions, personalise feeds and display advertisements. To this end, Facebook has developed its own query language called Dragon, which is particularly lightweight and has been optimised for distributed queries.
Amazon Neptune Neptune is both an internal and externally available product. It is a graph database service that can be controlled via SPARQL and RDF. The main use cases are in AI-RAG applications, fraud detection, security operations and customer analysis.
Freely available graphs
According to its own information, Wikidata is currently the largest freely available knowledge graph project with over 119 million objects. The graph was originally developed to better display and verify Wikipedia content. With over 2 billion edits, Wikidata demonstrates a high level of maintenance, topicality and numerous connections between entities. DBpedia stores over 229 million objects and also makes them publicly available. Together, Wikidata and DBpedia form the most popular basis for freely accessible knowledge graphs. In addition to these general graphs, there are also specialised topic blocks that are published separately:
- ConceptNet focuses on fundamental concepts and implicit knowledge. This is particularly useful for neuro-symbolic learning, robotics, or the explainability of LLMs.
- UniProt is a protein database that supports biologists and medical professionals in the development of drugs and research into diseases.
- PubChem is the largest collection of chemical information on the internet, also organised as a knowledge graph.
- OpenStreetMap contains data for geospatial intelligence, including buildings, addresses, property sizes and other information on a global scale, which is accessible to everyone.
5. Summary & Outlook
In this chapter, we have ventured beyond the horizon and taken a closer look at knowledge graphs and ontologies. Knowledge graphs consist of entities and the connections between them, as they occur in the real world, and are typically stored in large databases according to the subject-predicate-object schema. Ontologies formally define the types and relations that occur in a knowledge graph. They not only enable the flexible extension and merging of individual graphs, but also structured queries and deductive and inductive analyses. In addition, we have looked at the basic technologies that make knowledge graphs accessible and found that graphs are chosen because of their atomic representation and strong interconnectivity, which offers many advantages for queries and analyses. In Chapter 3, we introduced the complex processes used to extract knowledge from knowledge graphs. Deductive methods work top-down and use model knowledge to process explicit knowledge. Inductive methods, on the other hand, are bottom-up and focus more on existing data, which means that knowledge graphs overlap with the field of traditional machine learning. We also looked at neuro-symbolic learning, which combines the advantages of machine learning and symbolic knowledge and is currently the focus of much attention. Finally, in the last chapter, we examined which companies offer knowledge graphs, how they are already being used today, and in which areas we encounter the results of these graphs on a daily basis.
What we have not covered in this article is the administrative or research side: building a knowledge graph, defining an ontology and maintaining it on an ongoing basis. This is a very time-consuming undertaking and also represents the biggest disadvantage of using graphs. The aim of this chapter was rather to highlight possibilities and make users aware of the opportunities and risks. It is difficult to predict whether knowledge graphs will prevail in certain areas, such as robotics, or whether large language models and fusion models will surpass the reliability of graphs in the future. What is certain, however, is that knowledge graphs will become increasingly important, especially in highly complex or critical areas where large amounts of data converge. While AI systems are often criticised for their lack of explainability, correctness and transparency, knowledge graphs can be a crucial building block in closing this gap between large AI models and the requirements for comprehensible, reliable systems.